I’d like to share my thoughts on “Test Data Size,” one of the most debated topics when designing a system trading strategy.
You might think, “Isn’t it better to use all the historical data available?” However, I take a different approach.
(There is no single right answer in trading—if it makes a profit, that’s your answer.)
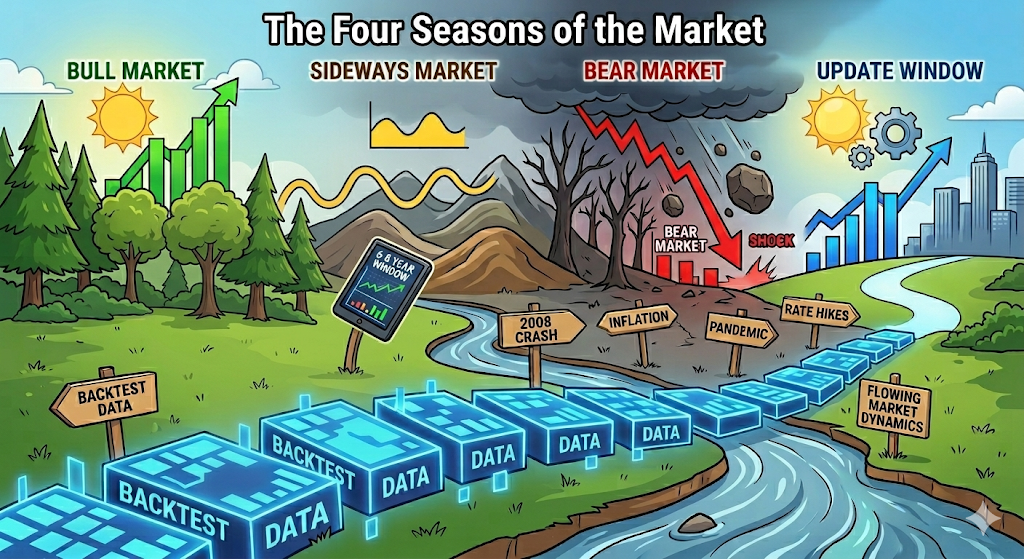
8 Years: Capturing the “Four Seasons” of the Market
People often say the market has a 4-year cycle that includes a bull market, a sideways market, and a bear market. Personally, I find 4 years a bit too short. You might get lucky and only test during a long-term uptrend.
That’s why I use a dataset of at least 6 years (about 1,500 trading days) to 8 years (about 2,000 trading days) as my base for backtesting. In 8 years, the market usually goes through two full cycles. This length of time ensures your strategy experiences almost every kind of market hardship
Let’s look at some of the major events in the U.S. market (S&P 500) from 2001 to recently:
| Year | Open | Close | Low | YoY Return | YoY Max Drawdown | Issue |
| 2025 | 5881.63 | 6845.5 | 4835.04 | 16.39% | -17.79% | Tariff Shocks |
| 2024 | 4769.83 | 5881.63 | 4682.11 | 23.31% | -1.84% | |
| 2023 | 3839.5 | 4769.83 | 3794.33 | 24.23% | -1.18% | |
| 2022 | 4766.18 | 3839.5 | 3491.58 | -19.44% | -26.74% | High Inflation & Aggressive Rate Hikes |
| 2021 | 3756.07 | 4766.18 | 3662.71 | 26.89% | -2.49% | |
| 2020 | 3230.78 | 3756.07 | 2191.86 | 16.26% | -32.16% | COVID-19 Pandemic & Massive Liquidity |
| 2019 | 2506.85 | 3230.78 | 2443.96 | 28.88% | -2.51% | |
| 2018 | 2673.61 | 2506.85 | 2346.58 | -6.24% | -12.23% | U.S.-China Trade War |
| 2017 | 2238.83 | 2673.61 | 2245.13 | 19.42% | 0.28% | |
| 2016 | 2043.94 | 2238.83 | 1810.1 | 9.54% | -11.44% | Brexit |
| 2015 | 2058.9 | 2043.94 | 1867.01 | -0.73% | -9.32% | Chinese Stock Market Crash |
| 2014 | 1848.4 | 2058.9 | 1737.92 | 11.39% | -5.98% | |
| 2013 | 1426.2 | 1848.4 | 1426.2 | 29.60% | 0.00% | |
| 2012 | 1257.6 | 1426.2 | 1258.9 | 13.41% | 0.10% | |
| 2011 | 1257.6 | 1257.6 | 1074.8 | 0.00% | -14.54% | U.S. Credit Rating Downgrade & Eurozone Debt Crisis |
| 2010 | 1115.1 | 1257.6 | 1010.9 | 12.78% | -9.34% | |
| 2009 | 903.2 | 1115.1 | 666.8 | 23.46% | -26.17% | Start of Quantitative Easing (QE) & Long-term Bull Market |
| 2008 | 1468.4 | 903.2 | 741 | -38.49% | -49.54% | Global Financial Crisis & Lehman Brothers Bankruptcy |
| 2007 | 1418.3 | 1468.4 | 1364 | 3.53% | -3.83% | |
| 2006 | 1248.3 | 1418.3 | 1219.3 | 13.62% | -2.32% | |
| 2005 | 1211.9 | 1248.3 | 1136.2 | 3.00% | -6.25% | |
| 2004 | 1111.9 | 1211.9 | 1060.7 | 8.99% | -4.60% | Fed Starts Raising Interest Rates |
| 2003 | 879.8 | 1111.9 | 788.9 | 26.38% | -10.33% | Iraq War → Dramatic Market Recovery |
| 2002 | 1148.1 | 879.8 | 768.6 | -23.37% | -33.05% | End of Dot-com Bubble & Accounting Scandals (Enron) |
| 2001 | 1320.3 | 1148.1 | 944.8 | -13.04% | -28.44% | 9/11 Attacks & Aftermath of the Dot-com Crash |
As you can see, within a 6 to 8-year window, you will inevitably hit a brutal bear market or an unexpected shock, no matter how good the market was.
My Alpha System Trading logic focuses on “surviving” these specific periods.
Like Flowing Water: The “Window” Update Method
The market is always changing. Trading volume today is incomparable to the early 2000s.
The dynamics between large-cap and small-cap stocks have shifted, and the market is now centered around tech stocks.
In my opinion, data that is too old can actually “pollute” a modern logic.
This is why I use a rolling window method: I add the latest data and push out the oldest data.
Instead of obsessing over results from 20 years ago, I focus on how well my logic blends into the current market environment.
The Battle with Excel: Proving Robustness
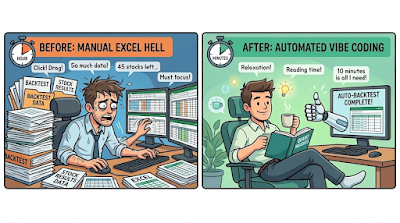
Whenever I have a new idea, I quickly simulate it in Excel first. One time, I pushed my logic to the limit to see if it could truly survive.
(Nowadays, I can do this much faster with AI!)
Here was my process:
- Refine the logic using 2001–2008 data, then simulate the year 2009.
- Use 2002–2009 data, then simulate the year 2010.
- Repeat this process year by year up to 2024 to check the “survival” status for every single year.
This task alone created a simulation folder over 1GB in size.
It was a long journey, but it gave me the confidence that “my logic can endure.” That allowed me to move to the next stage.
Closing Thoughts: No Right Answer, but Survival is Key
My method isn’t the only way. Some traders look at 20 years of data, while others focus only on the last 2 years.
There is no perfect answer.
However, I believe the most important thing is checking whether your logic can withstand the “four seasons” of the market without melting away.
Data is the only way to prove that resilience.