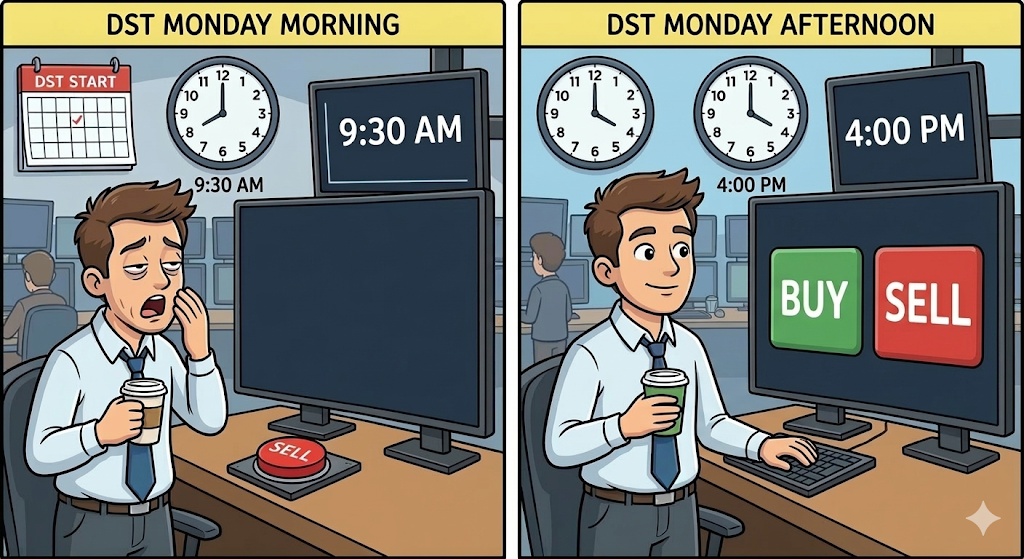
How Does the US Stock Market Move on the First Day of Daylight Saving Time (DST)?
Every spring, we move our clocks forward by one hour. On that Monday morning, when investors are operating on one less hour of sleep, which direction does the S&P 500 take? We analyzed data from the last 11 years to find out.
Why pay attention to the first day of DST?
In the United States, Daylight Saving Time (DST) begins on the second Sunday of March. As the clock skips from 2:00 AM to 3:00 AM, investors across the country lose an hour of sleep overnight.
According to sleep research, this single hour of loss can impact focus, judgment, and risk appetite. So, how has the market reacted on the following Monday—the first trading day after DST?
11-Year Data: SPY, QQQ, IWM (Close vs. Previous Close)
| Date | SPY | QQQ | IWM |
|---|---|---|---|
| 2016-03-14 | -0.13% | +0.17% | -0.26% |
| 2017-03-13 | +0.05% | +0.17% | +0.24% |
| 2018-03-12 | -0.13% | +0.53% | +0.18% |
| 2019-03-11 | +1.45% | +2.08% | +1.75% |
| 2020-03-09 COVID-19 | -7.81% | -6.95% | -9.72% |
| 2021-03-15 | +0.60% | +1.07% | +0.36% |
| 2022-03-14 | -0.73% | -1.92% | -2.04% |
| 2023-03-13 | -0.14% | +0.74% | -1.63% |
| 2024-03-11 | -0.09% | -0.37% | -0.79% |
| 2025-03-10 | -2.66% | -3.88% | -2.52% |
| 2026-03-09 | +0.88% | +1.34% | +1.09% |
※ Note: 2020 data is italicized due to the impact of the COVID-19 pandemic. Statistics exclude 2020 and are based on the remaining 10 years.
Summary Statistics by ETF (Excluding 2020)
- SPY (S&P 500) Negative Days 6 | Average return-0.09%
- QQQ (Nasdaq100) Negative Days 3 | Average return-0.01%
- IWM (Russell2000) Negative Days 5 | Average return-0.36%
How should we interpret this?
Looking at these three ETFs together reveals a few patterns.
The direction is generally consistent. When the market surged (like in 2019), all three rose; when it pulled back (like in 2025), all three fell.
This suggests that if a “DST effect” exists, it acts across the entire market.
What about the Opening Price?
11-Year Data: SPY, QQQ, IWM (Open vs. Previous Close)
| 날짜 | SPY | QQQ | IWM |
|---|---|---|---|
| 2016-03-14 | -0.30% | -0.39% | -0.30% |
| 2017-03-13 | -0.03% | -0.04% | -0.23% |
| 2018-03-12 | +0.12% | +0.28% | +0.21% |
| 2019-03-11 | +0.29% | +0.40% | +0.31% |
| 2020-03-09 COVID-19 | -7.45% | -6.99% | -7.11% |
| 2021-03-15 | +0.07% | +0.10% | -0.11% |
| 2022-03-14 | +0.20% | -0.39% | +0.26% |
| 2023-03-13 | -1.06% | -0.63% | -2.08% |
| 2024-03-11 | -0.24% | -0.34% | -0.42% |
| 2025-03-10 | -1.45% | -1.70% | -1.22% |
| 2026-03-09 | -0.89% | -0.92% | -1.32% |
※Note: 2020 data is italicized due to the impact of the COVID-19 pandemic. Statistics exclude 2020 and are based on the remaining 10 years.
Summary Statistics by ETF (Excluding 2020)
- SPY Negative Opens 6 | Opening Return-0.33%
- QQQ Negative Opens 7 | Opening Return-0.36%
- IWM Negative Opens 7 | Opening Return-0.49%
How should we interpret this?
The downward bias is much more consistent at the market open.
For all three ETFs, the frequency of a lower open is higher than that of a lower close, and the average returns are also lower at the open.
This suggests a potential pattern: the anxiety or grogginess caused by sleep deprivation may lead to selling immediately after the opening bell, which the market then attempts to recover during the trading session.